Macaly’s AI agent built a complete lightweight CRM — pipeline dashboard with live deal values, contact management, activity timeline and win/loss reporting. Five prompts, zero spreadsheets.
Overall stats
Features
Author
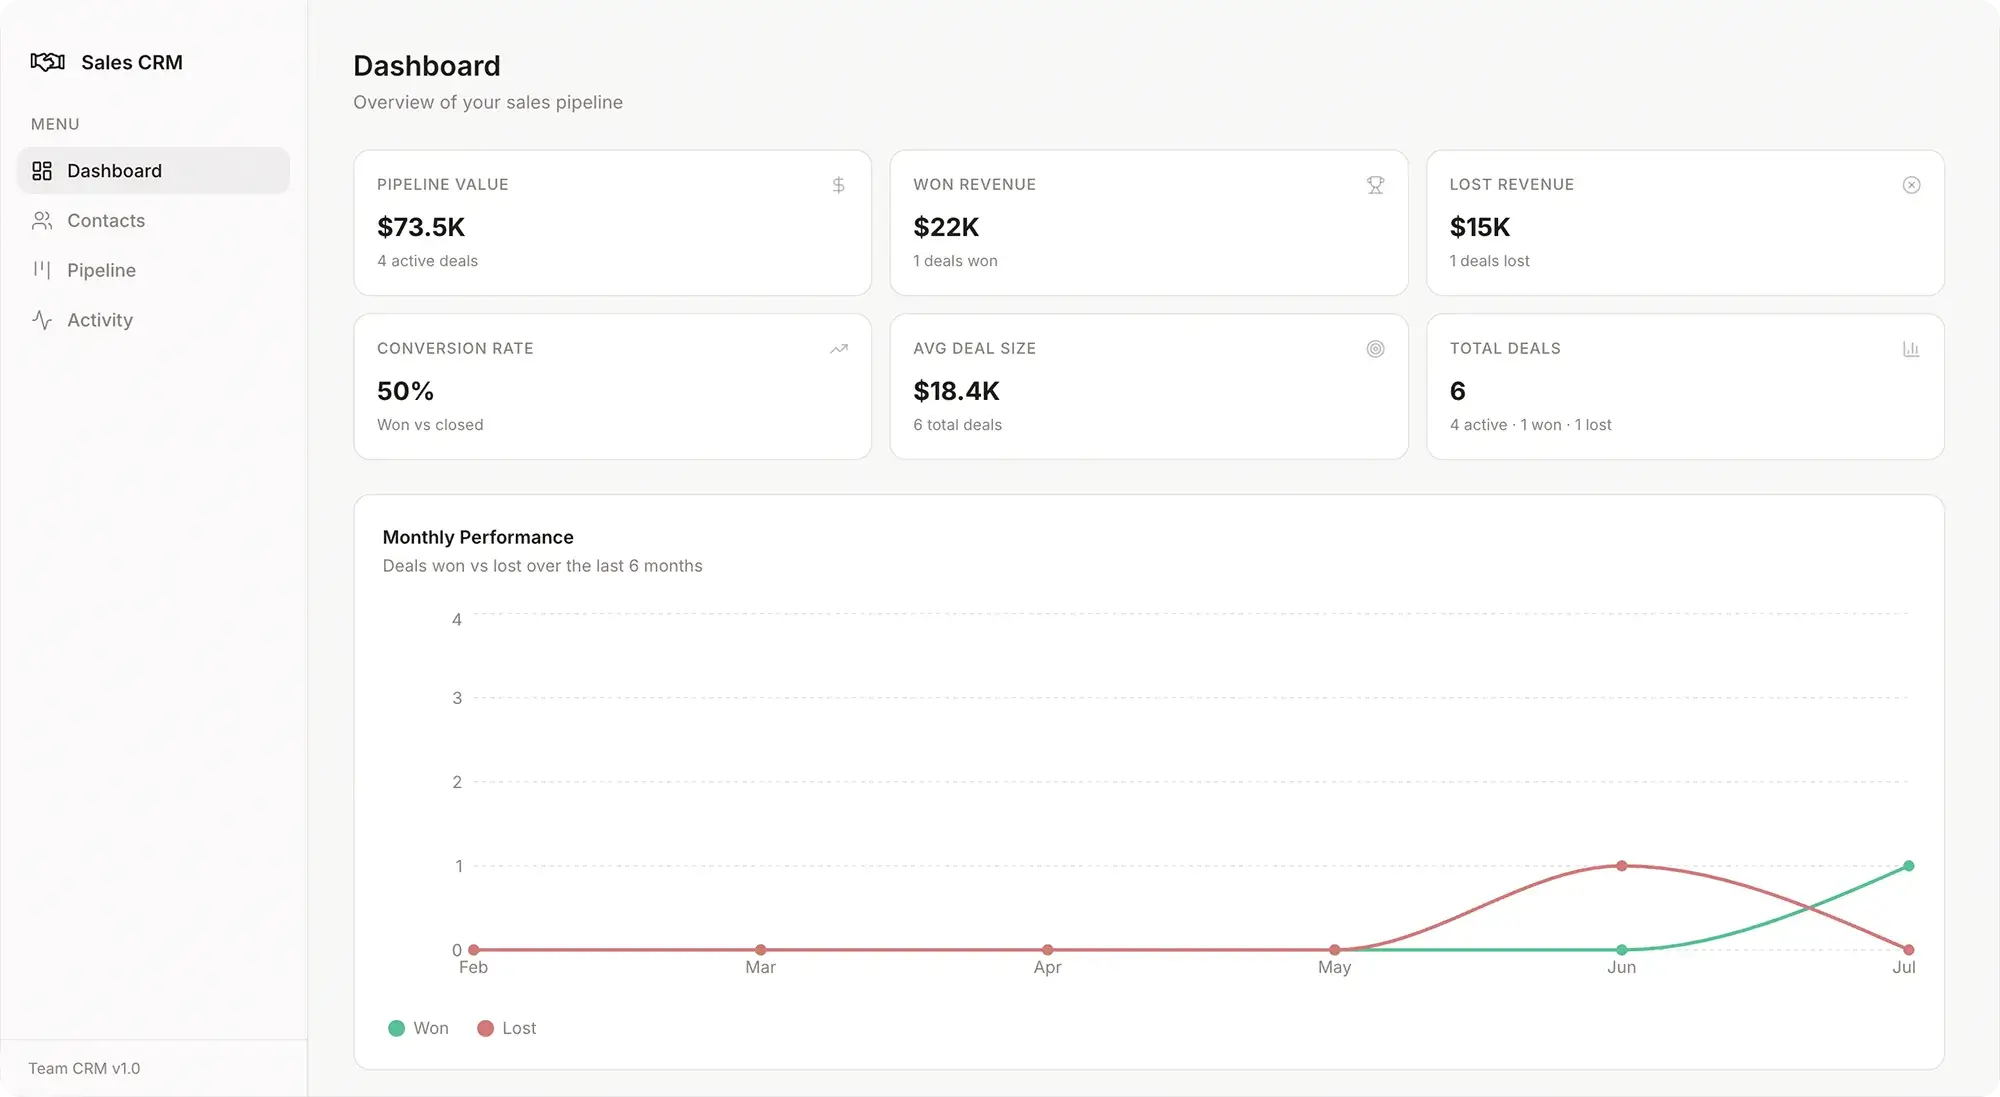
One prompt. It built the full app — a dashboard with pipeline value, won revenue, conversion rate and total deals, a monthly performance chart, plus contacts, pipeline and activity views. Clean light theme, navy accents.
Deals, contacts and notes moved into a real database — every edit syncs instantly and nothing is lost on refresh. Stage changes are logged with timestamps.
One sentence produced the monthly performance chart — won vs lost deals over six months, with clean legends and empty-state handling.
Login with roles: admins manage everything, reps only see their own deals. Sessions handled automatically — no configuration screens.
Consistent metric cards, keyboard shortcuts for the pipeline, and 14 tests written across the codebase. Zero errors.
Pipeline value, won revenue, conversion rate and deal counts update in real time as deals move through stages.
A monthly performance chart shows win and loss lines over six months, generated from real deal data — not typed-in numbers.
Admins manage every deal; reps see their own. Set up in one sentence, no admin console required.
Every call, note and stage change is logged automatically per contact, so context is never lost.
Light theme, navy accents, four metric cards and one chart. Nothing your team won't use.
Deal logic, permissions and rendering all covered before handoff.

